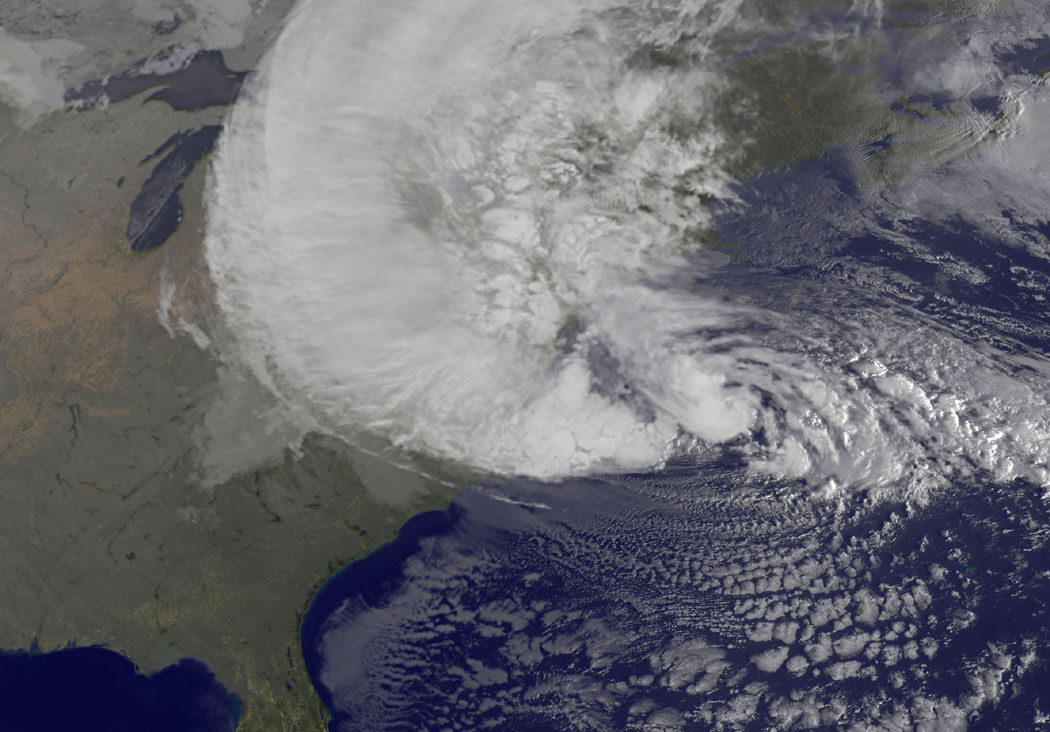
UPDATE #3 11/24: There is still a lot of uncertainty in Sandy damage estimates. PCS, which tabulates actual insured losses, has released a first estimate of $11 billion in insured losses. This is at the low end of the range, bu is very likely to rise. How far? We'll have to wait for that. Once better numbers are in, I'll do a new post with apples to apples numbers from Sandy to compare to our normalized tabulation.
UPDATE #2 11/1: Moody's has published an estimate of $30 billion in direct total damages due to Sandy. That would place Sandy at #10 all time in the normalization table below.
UPDATE 11/1: EQECAT has published updated estimates of Sandy's losses today, $10-20 billion insured and $30-50B total. Depending on the amount of flood damage include in the total (the NWS hurricane losses separate out flood) the new estimates, if they hold up near the high end of the range, would push Sandy into the top 10 all-time losses in the normalization table below.
Here is a table showing the top 20 hurricane losses 1900 to 2011, normalized to 2012 dollars. In other words, the figures show an estimate of what the losses would be were historical storms to occur in 2012. The numbers come from ICAT based on an extension of Pielke et al. 2008.
| STORM NAME | LANDFALL DATE | DAMAGE RANK | DAMAGE ($ 2012) |
| Great Miami | Sep 18,1926 | 1 | 180,220,000,000 |
| Galveston | Sep 08,1900 | 2 | 105,570,000,000 |
| Galveston | Aug 17,1915 | 3 | 84,910,000,000 |
| Katrina | Aug 29,2005 | 4 | 84,620,000,000 |
| Andrew | Aug 24,1992 | 5 | 64,410,000,000 |
| Storm 11 in 1944 | Oct 19,1944 | 6 | 53,940,000,000 |
| Donna | Sep 10,1960 | 7 | 49,810,000,000 |
| New England | Sep 21,1938 | 8 | 46,840,000,000 |
| Lake Okeechobee | Sep 16,1928 | 9 | 44,890,000,000 |
| Wilma | Oct 24,2005 | 10 | 25,960,000,000 |
| Hazel | Oct 18,1954 | 11 | 24,260,000,000 |
| Diane | Aug 19,1955 | 12 | 24,110,000,000 |
| Camille | Aug 17,1969 | 13 | 23,040,000,000 |
| Charley | Aug 13,2004 | 14 | 20,380,000,000 |
| Ike | Sep 13,2008 | 15 | 20,370,000,000 |
| Hugo | Sep 21,1989 | 16 | 20,020,000,000 |
| Carol | Aug 31,1954 | 17 | 19,290,000,000 |
| Agnes | Jun 22,1972 | 18 | 19,010,000,000 |
| Ivan | Sep 16,2004 | 19 | 18,590,000,000 |
| Storm 2 in 1949 | Aug 26,1949 | 20 | 18,510,000,000 |
While it will be some time until we have apples to apples estimates from Sandy, the current estimates of $20 billion would place Sandy at #17 all time out of 242 loss-producng storms 1900 to present (in the top 10%). If the damage gets to $30 billion it would crack the top 10 and (top 5%). Right now it seems unlikely that Sandy will climb any higher on the table. (Note that inland flood damage is not included in the tabulations above.)
In historical context, Sandy sits alongside Carol, Diane and Hazel. One big difference however -- Carol, Diane and Hazel hit the US Atlantic coast within a single 13 month period in 1954-1955. Imagine that.
