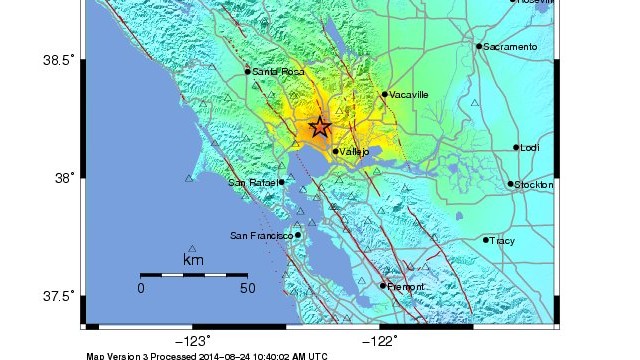
With news of a 6.0 magnitude earthquake today in San Francisco, I thought I'd provide a perspective on historical damage, The data in the table below are estimates of normalized damage for the top
There are a lot of uncertainties in earthquake normalization methods, and those interested in digging deeper should have a look at our paper for the gory details. The top event is the 1906 San Francisco earthquake, which reminds us that while big earthquakes are rare, they can do lots of damage. For perspective, a repeat of the 1906 San Francisco earthquake could cause more than twice the damage caused by all US tornadoes since 1950.
| Rank | Date | Normalized 2014 Damage | Deaths | Magnitude | Location |
| 1 | 18-Apr-06 | $345,207,435,386 | 2000 | 8.3 | San Francisco |
| 2 | 28-Mar-64 | $38,910,888,527 | 131 | 8.4 | Anchorage, Alaska |
| 3 | 18-Oct-89 | $37,521,623,532 | 62 | 7.1 | California, Loma Prieta |
| 4 | 17-Jan-94 | $37,046,374,369 | 60 | 6.6 | Los Angeles |
| 5 | 11-Mar-33 | $19,340,807,766 | 100 | 6.3 | California, Long Beach |
| 6 | 13-Apr-49 | $11,078,046,116 | 8 | 7.0 | Olympia, Washington |
| 7 | 18-May-80 | $9,495,474,795 | 31 | 5.2 | Washington, Mt St. Helens |
| 8 | 9-Feb-71 | $9,197,179,695 | 65 | 6.5 | California, San Fernando |
| 9 | 28-Feb-01 | $6,024,383,136 | 0 | 6.8 | Washingotn, Olympia |
| 10 | 11-Oct-18 | $5,670,099,871 | 116 | 7.5 | Puerto Rico |
| 11 | 19-May-40 | $5,036,397,660 | 9 | 6.5 | Imperial Valley (California) |
| 12 | 21-Jul-52 | $4,116,494,364 | 13 | 7.7 | Central Calfornia |
| 13 | 19-Oct-35 | $3,989,310,216 | 2 | 6.2 | Montana |
| 14 | 29-Jun-25 | $3,729,835,249 | 13 | 6.3 | Santa Barbara (California) |
