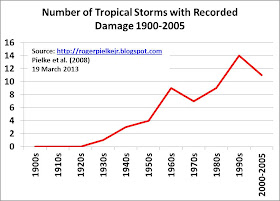
UPDATE2: I see that Grinsted is changing his "rebuttal" in real time and without acknowledgment of the changes (not good blog etiquette;-). So please do note that the post below is a response to the rebuttal as it stood March 19th, which now has evolved. In the latest version, Grinsted grants my major points (great!), so I think this debate has come to a close. Readers are invited to judge for themselves whether the Grinsted et al. surge index should be preferred in any way to existing datasets on US hurricane landfall frequencies and intensities, as a measure of past hurricane incidence.
Aslak Grinsted, the lead author of a new paper in PNAS this week which predicts a hurricane Katrina every other year in the decades to come, has just responded to my earlier critique of their methods. The new paper depends on that earlier work, and I am afraid suffers the same faults. My earlier critique can be found here and Grinsted's response is here. I welcome the exchange. Here I explain why Grinsted's response is off base and repeats the problematic analysis found in the original paper.
In his response to my critique, Grinsted claims to see a marked increase in the number of damaging storms from our normalized loss dataset. This "surprising" discovery apparently supports the conclusion of ever worsening hurricanes, and it has been missed all this time. Grinsted shows the following graph.
Grinsted explains the graph as follows (emphasis added):
I find it interesting to plot the frequency of extreme normalized damage events. I have a chosen to define extreme damage so that so that it corresponds to roughly the same number of events as UScat1-5. Surprisingly there is a strong trend. The same clear trend is not in total normalized damage per year. It clearly shows that the distribution is not stationary.Once again we see how the notion of "roughly" introduces some problems for the analysis. Let me explain -- precisely.
On the graph (at the top) Grinsted says that he has included the top 205 most damaging events from our dataset for 1900 to 2005 (our paper and dataset can be found here). Our dataset has 217 total events, which includes landfalling storms of tropical storm strength (those which are named storms but at less than hurricane strength) as well as landfalling Category 1 to 5 hurricanes. Grinsted's black curve shows Category 1-5 landfalling hurricanes and the red curve shows what he claims to be "roughly the same number of events as UScat1-5." This claim is wrong.
By using the top 205 damaging events, that means that Grinsted dropped off the bottom 12 least-damaging events. The bottom 12 events include 8 Tropical Storms: Fay (2002), Beryl (1988), Chris (1982), Isidore (1984), Allison (1995), Chris (1988), Dean (1995) and Gustav (2005) plus 4 Category 1 hurricanes: Bonnie (1986), Alex (2004), Florence (1988) and Floyd (1987).
Grinsted missed 50 other storms of less-than-hurricane strength. Put another way, there are only 155 damaging events of Category 1-5 strength from 1900 to 2005, yet Grinsted graphed 205 events. So 205 is "roughly" 155, and I once again am "roughly" 18 feet tall.
Why does this matter?
I am sorry to disappoint. The actual reason for the increasing number of damaging tropical storms has to do with the reporting of damages. Typically, such storms have very low damages and simply were included less frequently in the official records of the National Hurricane Center. Today, every storm comes with a damage estimate -- small or large.
The neglect of past tropical storms in the NHC dataset does introduce a very small bias in our results -- from 1900 to 2005 the normalized losses (in 2005 dollars) from all landfalling storms of tropical storm (i.e., less than Category 1) strength are about 2% of the total losses. Of note there were also 8 storms of hurricane strength which made landfall prior to 1940 which had no loss estimates (and thus these also do not appear in our dataset or in Grinsted's graph). Adding in past storms with missing loss estimates would have the effect of making the damage estimates of the distant past as much as several percent higher annually from 1900-1940. That wouldn't change our results in any meaningful way (and works against those laboring to find a trend in our so-far trend-free dataset).
What the small bias will do instead is perhaps confuse someone who looks at our dataset without understanding it, much less someone who treats it "roughly." Obviously this error also confounds Grinsted's efforts to create correlations bewteen our dataset and others.
When you correctly compare the historical record of US hurricane landfalls to our damage record you will find a perfect match (assuming that the 8 hurricanes prior to 1940 with zero damage would cause damage today), as every landfalling Category 1-5 storm since 1940 has a damage estimate. Tellingly, in his rebuttal, Grinsted has committed the exact same type of error that was committed in his original paper -- he has looked at data and seen in it something which it does not hold.
The bottom line here is clear. If you want to look at trends in hurricanes, there is absolutely no need to construct abstract indices as there is actually good data on hurricanes themselves. Look for yourself:


