[UPDATE #2: I will be moving on to more (less?) fruitful topics. But let me wrap up this interesting episode by restating that I stand by everything in this post and the discussion in the comments here and elsewhere. The RC11 methodology does not make any use of data prior to 1910 insofar as the results are concerned (despite suggestions to the contrary in the paper). If there is a criticism of this post to be leveled it is, as several professional colleagues have observed in emails to me, that 1911 is not the right cutoff for the cherrypick, but it is more like 1980 (i.e., they argue that no data before 1980 actually matters in the methodology). This is a fair criticism. I'll be using the RC11 paper in my graduate seminar next term as an example of cherry picking in science -- a clearer, more easily understandable case you will not find.]
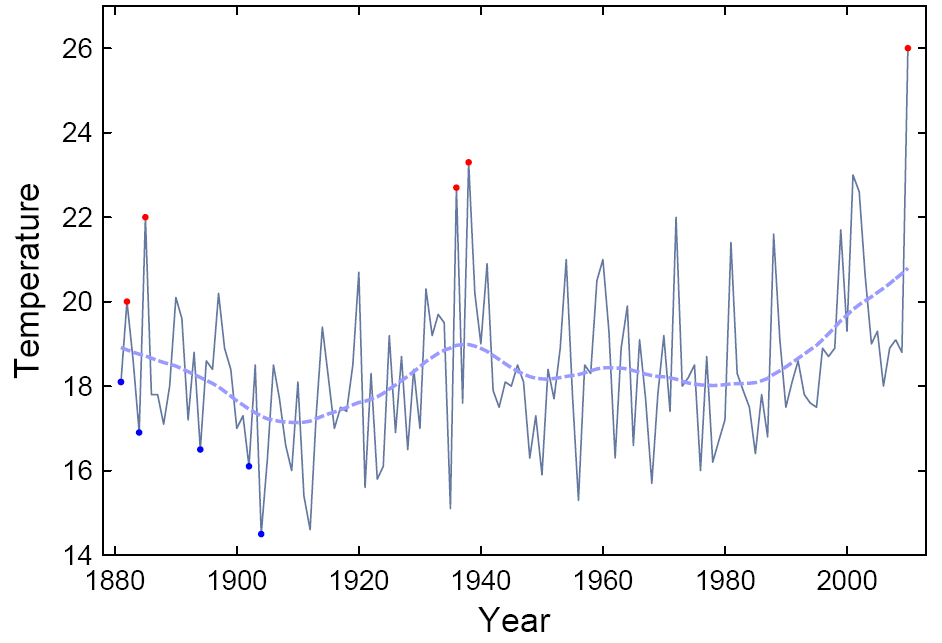
[UPDATE: At Real Climate Stefan Rahmstorf has a long and laborious post trying to explain not only the 1911 cherry pick, but several others that defy convention in attribution studies. In the comments below I publish Stefan's response to my query -- They used "trends" (using a new definition of that term in climate science) such that the "trend" from 1911 is the same as that from 1880. Look at the graph below and ask yourself how that can be -- Climate science as ink blot.]
Here is another good example why I have come to view parts of the climate science research enterprise with a considerable degree of distrust.
A paper was released yesterday by PNAS, by Stefan Rahmstorf and Dim Coumou, (also freely available here in PDF) which asserts that the 2010 Russian summer heat wave was, with 80% probability, the result of a background warming trend. But if you take a look at the actual paper you see that they made some arbitrary choices (which are at least unexplained from a scientific standpoint) that bias the results in a particular direction.

Obviously, any examination of statistics will depend upon the data that is included and not included. Why did Rahmsdorf and Coumou start with 1911? A century, 100 years, is a nice round number, but it does not have any privileged scientific meaning. Why did they not report the sensitivity of their results to choice of start date? There may indeed be very good scientific reasons why starting the analysis in 1911 makes the most sense and for the paper to not report the sensitivity of results to the start date. But the authors did not share that information with their readers. Hence, the decision looks arbitrary and to have influenced the results.
Climate science -- or at least some parts of it -- seems to have devolved into an effort to generate media coverage and talking points for blogs, at the expense of actually adding to our scientific knowledge of the climate system. The new PNAS paper sure looks like a cherry pick to me. For a scientific exploration of the Russian heat wave that seems far more trustworthy to me, take a look at this paper.